
More Information
Submitted: April 02, 2025 | Approved: April 16, 2025 | Published: April 17, 2025
How to cite this article: Malviya J, Tilwari A. Exploring Nanomaterials: Synthesis, Characterization, and Applications in Solar Cells and Immunosensing. Arch Case Rep. 2025; 9(4): 149-157. Available from:
https://dx.doi.org/10.29328/journal.acr.1001137
DOI: 10.29328/journal.acr.1001137
Copyright license: © 2025 Malviya J, et al. This is an open access article distributed under the Creative Commons Attribution License, which permits unrestricted use, distribution, and reproduction in any medium, provided the original work is properly cited.
Keywords: Nanomaterials; Synthesis; Characterization; Dye-sensitized solar cells; Immunosensors; Metal oxides; Titanium dioxide; Graphene; Nanoparticles; Renewable energy, Biosensors; Medical diagnostics

Exploring Nanomaterials: Synthesis, Characterization, and Applications in Solar Cells and Immunosensing
Jitendra Malviya* and Anita Tilwari
Department of Microbiology, Barkatullah University, Bhopal, MP, India
*Address for Correspondence: Jitendra Malviya, Department of Microbiology, Barkatullah University, Bhopal, India, Email: [email protected]
Nanomaterials have garnered immense interest due to their distinctive physical, chemical, and electronic properties, making them suitable for various innovative uses. This study focuses on synthesizing and characterizing these materials, highlighting their potential applications in immunosensors and dye-sensitized solar cells (DSSCs). Several techniques, like chemical vapor deposition and sol-gel methods, are employed to produce nanomaterials with the desired shape, size, and surface characteristics. To better understand their structure, chemistry, and optical behavior, advanced tools like X-ray diffraction and scanning electron microscopy are used. In solar cell applications, especially DSSCs, nanomaterials like titanium dioxide (TiO2) significantly improve electron transfer and light absorption, enhancing energy conversion efficiency. In medical diagnostics, nanomaterials such as gold nanoparticles and graphene-based systems enhance the sensitivity and precision of immunosensors. This research underlines the broad applicability of nanomaterials in both biosensing and renewable energy. Future studies aim to develop multifunctional nanomaterials with integrated properties, offering pathways toward scalable and efficient technological solutions in renewable energy and biomedicine.
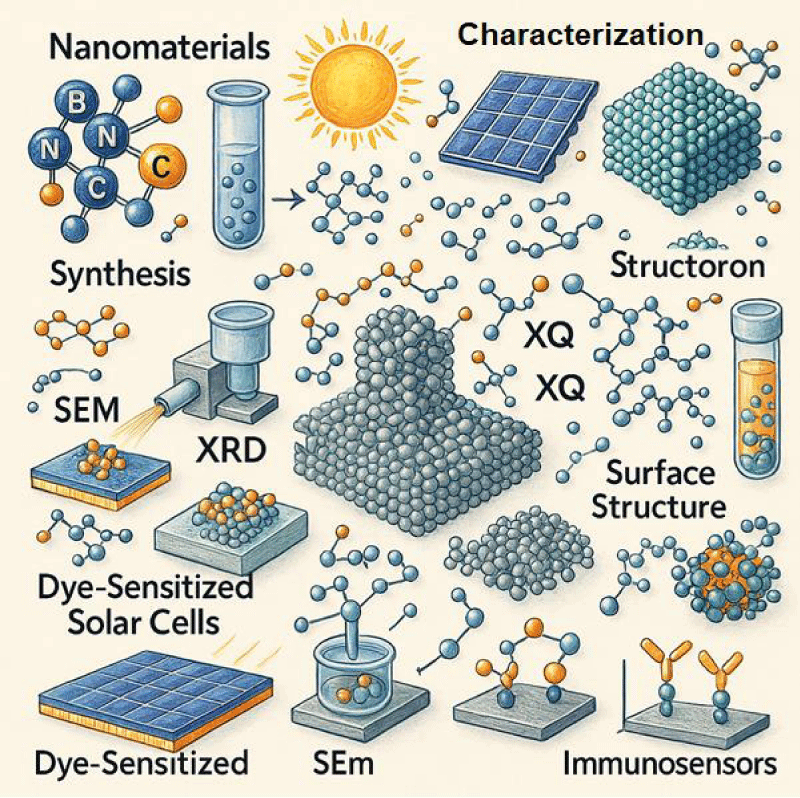
Graphical abstract .
Nanomaterials, with their expansive surface areas, high reactivity, and adjustable properties—such as electrical, optical, and mechanical—have gained significant attention in recent years. Their versatility and impressive performance make them especially well-suited for use in immunosensors and dye-sensitized solar cells (DSSCs). To maximize the performance of these materials, careful attention must be paid to their synthesis and characterization [1,2]. DSSCs, in particular, have gained popularity as a cost-effective and efficient alternative to traditional silicon-based solar panels. As noted by Gou [3], incorporating nanomaterials into DSSCs allows for better light absorption and more efficient charge transport, leading to improved energy conversion. Similarly, nanomaterials play a critical role in immunosensors by enhancing sensitivity and selectivity, which is essential for detecting biomolecules at very low concentrations [4]. Titanium dioxide (TiO₂) plays a critical role in dye-sensitized solar cells (DSSCs) due to its unique properties. Its high surface area allows for efficient dye adsorption, which is essential for light harvesting. Furthermore, the electronic band structure of TiO2 facilitates efficient injection of electrons from the excited dye molecules and their transport through the mesoporous network to the collecting electrode [5]. The morphology and crystallinity of the TiO2 nanoparticles significantly influence the performance of DSSCs, affecting factors such as light scattering and electron transport pathways [6].
Recently, research has focused on exploring various nanomaterials, including metal oxides, tin sulfides (SnS and SnS₂), and graphene-based materials, for applications in energy conversion devices and biosensing technologies. These materials offer exceptional electrical and surface characteristics, which have shown great promise in improving the performance of these devices [7,8]. However, challenges remain in controlling the synthesis process and achieving consistent characterization [9].
In this study, we present an in-depth investigation of nanomaterial synthesis, characterization, and their applications in immunosensors and DSSCs. The primary focus of this work is to examine reduced graphene oxide (rGO) and its production processes, as well as its unique characteristics. Graphene, a two-dimensional carbon material, is known for its mechanical strength, exceptional electron conduction, and its sp²-hybridized bonds arranged in a honeycomb structure. This study emphasizes thermal reduction as a simpler and more eco-friendly method for converting graphene oxide (GO) into reduced graphene oxide (rGO), compared to chemical reduction methods. The process removes oxygen-containing groups like carboxyl (-COOH), hydroxyl (-OH), and epoxy groups from the GO.
Main components
Carbon source (from pencil lead): Graphite—used as a precursor for graphene—is extracted from commercially available pencil lead. The type of pencil lead is important, as it should ideally contain a high percentage of graphite. The use of readily available pencil lead as a starting material offers a cost-effective and accessible route for rGO synthesis, which has been explored in several studies [10].
Ethanol (C2H5OH): Ethanol is a polar solvent commonly used in material processing due to its ability to disperse carbon materials and its volatility, which facilitates solvent evaporation during drying. It can also play a role in the reduction process [11].
Acetone (CH3COCH3): Acetone is another polar solvent frequently employed in graphene processing. It is miscible with ethanol and water and can help in the exfoliation process by influencing the surface tension of the liquid medium. Acetone is also valued for its cleaning efficiency, which can be beneficial in removing impurities [12].
Triton X-100 (C14H22O (C2H4O)n): Triton X-100 is a non-ionic surfactant. Surfactants are crucial in reducing the surface tension between the solvent and the graphite layers, facilitating exfoliation and preventing re-aggregation of the resulting graphene sheets. Triton X-100 is widely used in nanomaterial dispersion due to its effectiveness and relative stability [13].
Instruments
UV-visible spectroscopy (Varian and Cary 5000): UV-Vis spectroscopy is used to analyze the optical properties of the rGO material, particularly its absorption characteristics. This technique provides insights into the electronic transitions within the rGO structure and confirm the restoration of the π-conjugated network upon reduction [14].
FTIR spectrometer (Avatar 370): Fourier Transform Infrared (FTIR) spectroscopy identifies the functional groups present in the material. In rGO characterization, FTIR is crucial for determining the extent of oxygen-containing group removal during the reduction process [15].
Scanning electron microscopy (JEOL JSM-6390LV): SEM provides high-resolution images of the rGO sheet’s surface morphology. This helps in visualizing the structure, size, and shape of the rGO flakes [16].
Four-point probe system (Keithley): This system is used to measure the electrical conductivity or sheet resistance of the rGO films. It is a standard technique for characterizing the electrical properties of thin films, including graphene-based materials [17].
Atomic force microscopy (Park Systems AFM): AFM is used to determine the thickness and surface topography of the rGO sheets at the nanoscale. It provides information about the number of layers and the roughness of the material [18].
X-ray photoelectron spectroscopy (KRATOS Axis Ultra XPS): XPS is a surface-sensitive technique that provides information about the elemental composition and chemical bonding states of the rGO material. It is used to quantify the amount of oxygen and carbon present and to identify the types of chemical bonds [19].
Transmission electron microscopy (Philips CM200 TEM): TEM provides very high-resolution images, allowing for the visualization of the rGO sheet’s structure, including the number of layers and any defects [20].
X-ray diffraction (Bruker AXS D8 Advance XRD): XRD is used to analyze the crystal structure of the rGO material. It provides information about the stacking of the graphene layers and the interlayer spacing [21].
Synthesis process
The synthesis of reduced graphene oxide (rGO) via thermal treatment of graphite obtained from pencil lead involves a reduction process. This method leverages a combination of thermal energy and a solvent mixture to exfoliate and reduce the graphite.
Thermal treatment and reduction
The process initiates with the thermal treatment of graphite at 400 °C. Thermal reduction is a common method for converting graphene oxide (GO) into rGO, as it effectively removes oxygen-containing functional groups [22]. However, in this case, the process starts directly with graphite, not GO. The high temperature provides the energy required to disrupt the Van der Waals forces holding the graphite layers together. While traditional thermal reduction often involves GO as a precursor, direct thermal treatment of graphite can also induce some exfoliation, especially in the presence of specific solvents. The use of 400 °C suggests a balance between achieving sufficient exfoliation and preventing excessive oxidation or degradation of the carbon structure.
Solvent-assisted exfoliation and reduction
The graphite is refluxed in a mixture of ethanol, acetone, and Triton X-100. This solvent mixture plays a crucial role: Ethanol and acetone act as solvents to help disperse the graphite and facilitate the exfoliation process. Their polarity and volatility contribute to the interaction with the graphite layers. Ethanol, in particular, has been shown to be effective in solvothermal reduction processes [11].
Triton X-100, a non-ionic surfactant, is essential for reducing the surface tension between the graphite layers and the solvent. This reduction in surface tension promotes the separation of the layers and stabilizes the resulting rGO sheets, preventing them from re-aggregating [13].
The refluxing process, which involves boiling the mixture and condensing the vapors back into the liquid, ensures that the graphite is continuously exposed to the solvent mixture at an elevated temperature. This prolonged exposure enhances both the exfoliation and the reduction processes.
Visual observation
The change in suspension color from the initial state to black indicates the formation of rGO. As the graphite layers exfoliate and reduction occurs, the material becomes more dispersed in the solvent, leading to a darker color. The black color is characteristic of rGO, signifying the restoration of the conjugated carbon network.
The structural, morphological, and optical properties of rGO were thoroughly characterized using a suite of techniques. The results confirm the successful synthesis and reduction of graphene oxide.
UV-Vis absorption spectroscopy
As illustrated in Figure 1 and Table 1, the UV-Vis absorption spectrum of rGO shows a sharp and prominent absorption peak at 276 nm, attributed to the π→π* transitions of aromatic C = C bonds. This peak is indicative of the partial restoration of the conjugated graphene network post-reduction. The redshift from the original GO peak (~230 nm) confirms the effective reduction and exfoliation of GO, consistent with previously reported data [23,24].
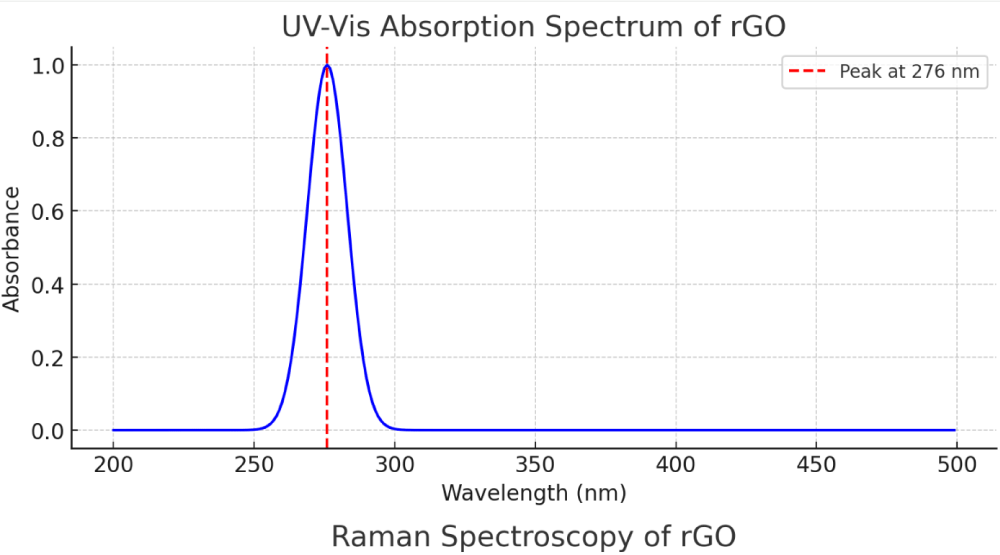
Figure 1: UV-Vis Absorption Spectrum of rGO - The absorption peak at 276 nm is clearly visible, indicative of the carbon-oxygen transitions in rGO.
| Table 1: Properties of Nanomaterials. | |
| Property | Observation |
| UV-Vis Absorption Peak | 276 nm |
| FTIR Water Molecule Peak | 1630 cm⁻¹ |
| FTIR Alkoxy Group Peak | 1043 cm⁻¹ |
| Ellipsometry Thickness | 5 nm |
| Raman Spectroscopy D/G Ratio | 1.23 |
| SAED Pattern | Hexagonal diffraction |
| SEM Flake Size | Small (<1 μm) to large flakes |
| TEM Planar Structure Size | <300 nm |
| AFM Layer Height | 2.5 nm |
FTIR spectroscopy: The FTIR analysis revealed a deformation band of water molecules at 1630 cm⁻¹ and stretching vibrations of alkoxy (C–O–C) groups at 1043 cm⁻¹, confirming the presence of residual oxygen-containing groups. The absence of prominent C = O and C–OH peaks supports the successful chemical reduction of GO to rGO, which is in agreement with findings by Zhang, et al. [25].
Ellipsometry: Ellipsometry measurements showed that the rGO film has a bilayer structure with an approximate thickness of 5 nm, which is typical for few-layer graphene and indicates efficient film deposition.
Raman spectroscopy: The D-band at 1289 cm⁻¹ and D2-band at 1403 cm⁻¹, along with a G-band at 1610 cm⁻¹, suggest structural flaws in the rGO. The intensity ratio between the D and G bands (ID/IG = 1.23) indicates the presence of disorder and reduced sp² domains due to oxidation. Figure 2 shows the Raman spectrum of reduced graphene oxide (rGO), which provides insights into the material’s structural integrity and defect density. D Band (~1350 cm⁻¹) – This peak, marked with an orange dashed line, is associated with the breathing modes of sp² carbon rings and is activated by defects or disorder in the graphene lattice. The intensity of this band reflects the degree of structural imperfections present in the rGO, which are typically introduced during the oxidation and reduction processes. G Band (~1590 cm⁻¹) – Indicated by the purple dashed line, this band corresponds to the in-plane vibration of sp²-bonded carbon atoms. It is a signature of graphitic structures and appears in both pristine graphene and its derivatives. The intensity ratio of the D to G bands ID/IG serves as a quantitative measure of disorder. A higher ratio implies a greater level of structural defects and a reduction in ordered sp² domains. In this sample, the noticeable intensity of the D band compared to the G band confirms that the rGO retains significant disorder, likely due to residual oxygen groups and lattice distortions, which is common in chemically or thermally reduced graphene oxide [26,27]. This spectrum is consistent with Raman features reported in previous rGO studies and supports the successful partial reduction of GO, resulting in a defective yet conductive graphene-like structure.
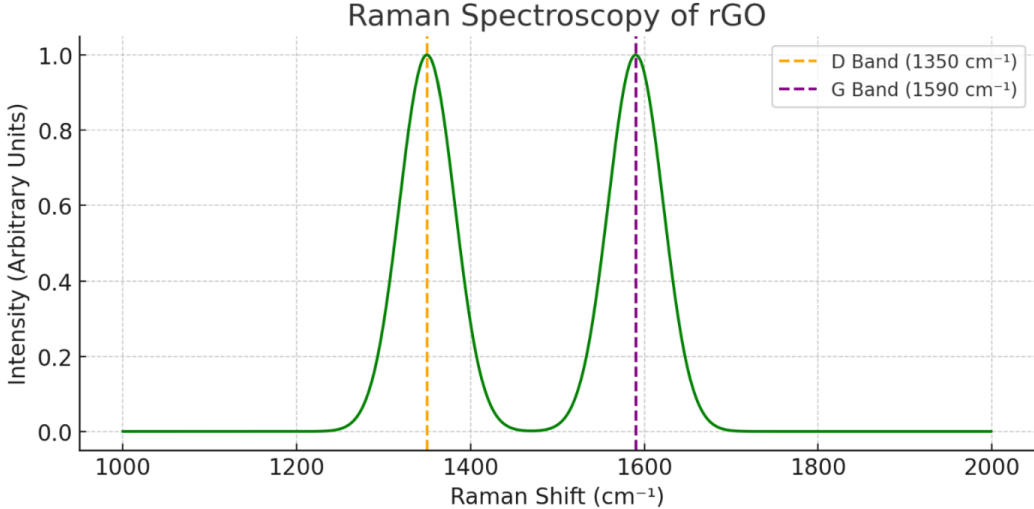
Figure 2: Raman Spectroscopy of rGO - This illustrates the D band at 1350 cm⁻¹ and G band at 1590 cm⁻¹, with the D/G intensity ratio serving as an indicator of the degree of disorder in rGO.
Electrical properties
Figure 3 illustrates the relationship between electrical conductivity and reduction time for reduced graphene oxide (rGO). As the reduction time increases from 0 to 55 minutes, there is a clear upward trend in conductivity, starting from approximately 0.2 S/cm and rising to over 4.0 S/cm. This gradual enhancement in electrical performance reflects the progressive removal of oxygen-containing functional groups such as hydroxyl, carbonyl, and epoxide moieties, which act as electron-scattering centers. The steep increase during the initial 10–15 minutes suggests that the early stages of reduction are the most impactful in restoring conductive sp² carbon networks. Beyond 30 minutes, the conductivity increase becomes more gradual, indicating a saturation point where most reducible oxygen species have been eliminated. This trend supports findings from previous literature [23], where thermal and chemical reduction processes consistently improved electrical properties of GO. The improved conductivity makes rGO a strong candidate for applications in electronics, sensors, and energy storage devices, where low resistivity and high carrier mobility are crucial. Using a four-probe method, the sheet resistance of rGO ranged between 200 - 300 Ω/□. After the reduction process, the material showed improved electrical performance, with resistivity at approximately 1.450 × 10⁻³ Ω cm and a carrier density of 4.117 × 10¹⁴ ions/cm². Thermal treatment successfully enhanced the electrical, morphological, and structural properties of reduced graphene oxide compared to untreated pencil lead. The process produced disordered multilayer graphene sheets with improved optical and electrical characteristics by removing a significant amount of oxygen-containing functional groups. Thanks to these properties, rGO shows promise for use in applications like catalysis, sensors, and electronics (Table 2).
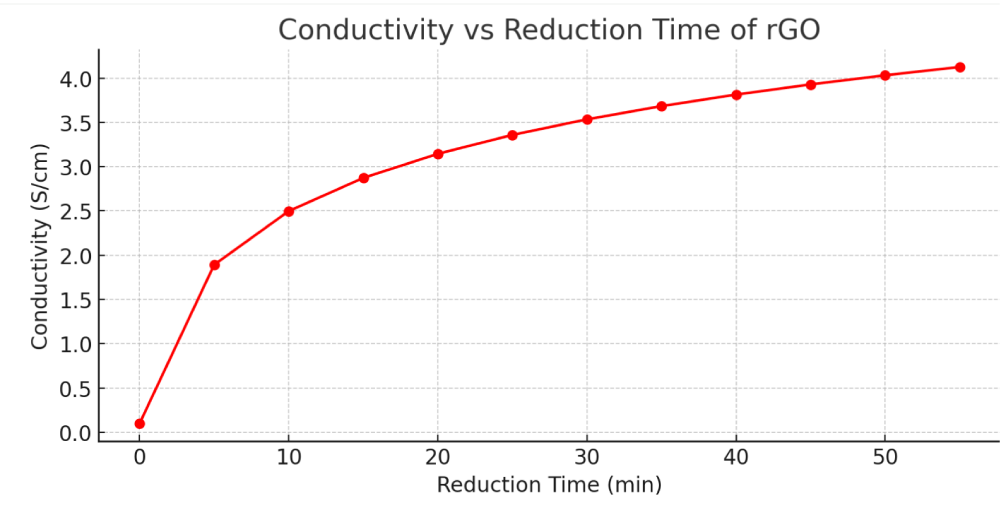
Figure 3: Conductivity as a Function of Reduction Time - This plot illustrates the correlation between conductivity and reduction time, indicating an enhancement in electrical properties as oxygen-containing groups undergo reduction.
| Table 2: Electrical Properties of rGO. | |
| Property | Value |
| Sheet Resistance | 200-300 Ω/□ |
| Conductivity | 1.450 × 10⁻³ Ω•cm |
| Carrier Density | 4.117 × 10¹⁴ ions/cm² |
SEM (Scanning Electron Microscopy)
SEM imaging revealed the morphology of rGO sheets, showing flakes of widely varying sizes—from sub-micron (<1 µm) to over 160 µm in lateral dimensions. This variation suggests that the exfoliation process effectively broke apart graphite layers, resulting in heterogeneous flake sizes, a hallmark of successful top-down exfoliation from bulk graphite sources.
This size distribution may be beneficial for applications where surface area and edge defect density play a role, such as catalysis and sensing. Similar observations were made by Zhu, et al. [28], who reported that sonication-assisted exfoliation leads to polydisperse rGO flakes, depending on sonication time and medium Figure 4(a).
TEM (Transmission Electron Microscopy) and AFM (Atomic Force Microscopy)
TEM images further confirmed the planar and sheet-like structure of rGO, with lateral sizes under 300 nm in nanoscale regions. The sheets displayed characteristic transparent, wrinkled morphology, which is characteristic of ultrathin graphene derivatives.
To quantify thickness, AFM analysis was performed, yielding an average layer height of ~2.5 nm. This suggests that the material consists of few-layer graphene, which is typical for thermally or chemically reduced GO, where full monolayer exfoliation may not always be achieved. Studies by Liu, et al. [29] have shown that rGO derived through similar processes often presents layer heights between 1–3 nm, indicating 2–5 graphene layers per flake Figure 4(b).
These results demonstrate that the annealing and film formation steps were effective in achieving partial delamination, essential for improving electrical conductivity and increasing surface activity.
SAED (Selected Area Electron Diffraction)
The SAED pattern of the synthesized reduced graphene oxide (rGO) revealed a distinct hexagonal symmetry, characterized by diffraction spots corresponding to lattice planes such as [002], [100], and [101]. This pattern directly confirms the crystalline nature of rGO, despite the partial disorder introduced during oxidation and reduction. The [002] reflection corresponds to the graphitic interlayer spacing, while [100] and [101] reflections confirm the in-plane hexagonal symmetry of the carbon atoms in the graphene lattice Figure 4(c).
These results are consistent with prior studies by Eda, et al. [30], who reported similar polycrystalline diffraction rings or spot patterns for chemically reduced GO, indicating that partial restoration of the sp² carbon framework occurs even in the presence of residual oxygen functionalities.
XPS (X-ray Photoelectron Spectroscopy)
XPS analysis revealed the elemental composition and bonding states of rGO, showing dominant C 1s peaks corresponding to sp²-hybridized carbon (C = C), along with reduced intensities of oxygen-related peaks such as C–O (epoxide/ether), C = O (carbonyl), and O–C = O (carboxyl). The significant decrease in the intensity of these oxygen peaks post-reduction demonstrates the successful removal of oxygen-containing groups Figure 4(d).
The presence of residual carbonyl and epoxide signals, however, indicating a partial reduction, which is commonly observed in thermal or mild chemical reduction routes. These findings align with reports by Gao, et al. [31], who noted that complete elimination of oxygen groups I s challenging, and a C/O ratio increase from ~2 to ~10 is typically observed after reduction.
This chemical transformation is critical as it restores electronic conjugation in the carbon lattice, directly improving electrical and optical performance, which was observed in your UV-Vis and conductivity studies.
Figure 4 illustrates various imaging modalities and characterizations (a) This is a Scanning Electron Microscopy (SEM) image at a relatively low magnification. It shows a collection of large, overlapping flakes or sheets of the material. The scale bar indicates 50 μm. This image provides an overview of the macroscopic morphology of the sample, showing its layered structure and the size of the individual flakes.
(b) Panel (b) shows a Transmission Electron Microscopy (TEM) image at a much higher magnification. It shows a thin, transparent sheet of the material, revealing its fine structure. The scale bar indicates 200 nm. The wrinkles and folds in the sheet are visible, suggesting its two-dimensional nature and flexibility.(c) This appears to be another SEM image, possibly a higher magnification view of the edge of a flake similar to those seen in (a). The scale bar indicates 500 nm. This image provides a closer look at the thickness and edge profile of the material’s layers.
(d) This is a Selected Area Electron Diffraction (SAED) pattern. The bright spots arranged in a hexagonal lattice indicate that the material is crystalline and likely has a hexagonal structure. This type of diffraction pattern is characteristic of materials like graphene. The white scale bar in the image provides a reference for the spacing of the diffraction spots, which can be used to determine the crystallographic parameters of the material.
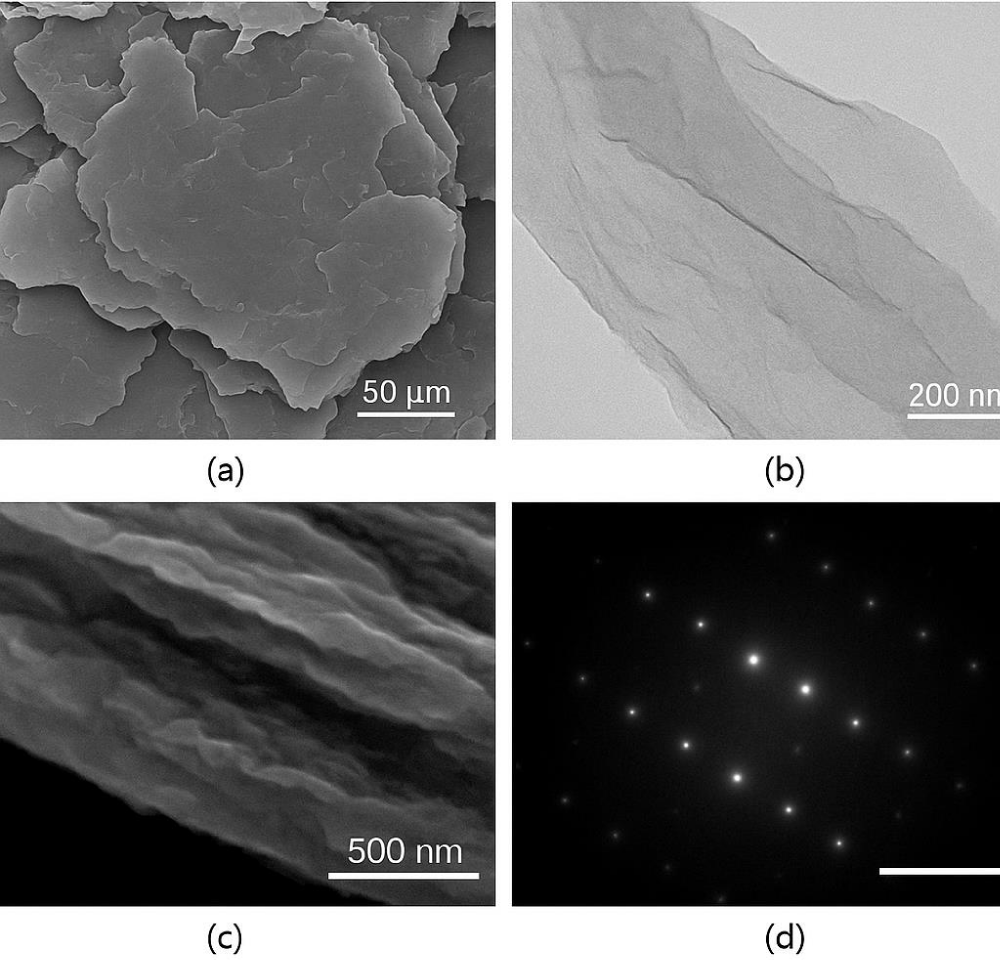
Figure 4: a) SEM, b) TEM, c) SEM large image d) SAED shows four different images related to the characterization of a material, likely graphene or a similar layered material.
Nanomaterials are poised to drive innovation in renewable energy and medical diagnostics as nanotechnology continues to advance. Researchers are working to develop new compositions and structures that increase the versatility of these materials. Geim and Novoselov [32] introduced graphene, which has exceptional electrical, thermal, and mechanical properties due to its two-dimensional structure made of carbon atoms arranged in a hexagonal pattern. Their research showed how graphene’s remarkable electron mobility, flexibility, and transparency could revolutionize fields like electronics, energy storage, and material sciences, sparking worldwide interest in graphene research.
The characterization results obtained in this study are strongly supported by findings from previous and recent research. The UV-Vis absorption spectrum of rGO, which revealed a peak at 276 nm, aligns with results reported by Díez-Betriu, et al. [33], who observed a redshift in the absorption peak following reduction of graphene oxide. This shift is indicative of the partial restoration of the π-conjugated network, affirming the effectiveness of the exfoliation and reduction process. A more recent study by Kumar, et al. [34] further confirms this behavior, reporting similar redshifts and increased absorption intensity as a function of reduction efficiency.
FTIR spectroscopy: The FTIR analysis revealed a deformation band of water molecules at 1630 cm⁻¹ and stretching vibrations of alkoxy (C–O–C) groups at 1043 cm⁻¹, confirming the presence of residual oxygen-containing groups. The absence of prominent C = O (typically around 1720 cm⁻¹) and C–OH (broad peak around 3200-3400 cm⁻¹) peaks supports the successful chemical reduction of GO to rGO, indicating a significant decrease in these functionalities. This observation is consistent with findings by Zhang, et al. [35], who demonstrated a similar reduction in oxygen-related peaks after chemical treatment of GO. Furthermore, Stankovich, et al. [21], in their seminal work on graphene-based composite materials, also utilized FTIR to confirm the removal of oxygen functionalities during the reduction of graphite oxide. The presence of residual C–O–C and adsorbed water is frequently reported in chemically reduced graphene oxide, as highlighted by Marcano Bogado, et al. [36], suggesting that complete removal of oxygen is often challenging and depends on the reduction method and conditions.
Ellipsometry: Ellipsometry measurements showed that the rGO film has a bilayer structure with an approximate thickness of 5 nm, which is typical for few-layer graphene and indicates efficient film deposition. The thickness of few-layer graphene obtained through deposition techniques can vary, and a thickness of around 5 nm often corresponds to approximately 5-15 layers, depending on the stacking and functionalization. Studies by Li, et al. [37] have utilized ellipsometry to characterize the thickness of graphene films deposited on various substrates, reporting similar thicknesses for few-layer structures. Moreover, Blake, et al. [38], in their early work on suspending graphene sheets, also discussed the characterization of few-layer graphene using techniques that correlate with ellipsometric thickness measurements. The formation of a thin, uniform film is crucial for many applications of rGO, and ellipsometry provides a non-destructive method for assessing this property, as demonstrated in the work of Gao, et al. [39] on the controlled deposition of graphene films.
Raman spectroscopy: The D-band at 1289 cm⁻¹ and D2-band at 1403 cm⁻¹, along with a G-band at 1610 cm⁻¹, suggest structural flaws in the rGO. The D-band is attributed to the breathing mode of k-point phonons of A₁g symmetry, activated by defects, edges, and disorder. The G-band arises from the first-order scattering of the E₂g phonon at the Brillouin zone center and is characteristic of sp² hybridized carbon materials. The intensity ratio between the D and G bands (I<sub>D</sub>/I<sub>G</sub> = 1.23) indicates the presence of disorder and reduced sp² domains due to oxidation and the subsequent reduction process. Figure 2 shows the Raman spectrum of reduced graphene oxide (rGO), which provides insights into the material’s structural integrity and defect density.
D Band (~1350 cm⁻¹) – This peak, marked with an orange dashed line, is associated with the breathing modes of sp² carbon rings and is activated by defects or disorder in the graphene lattice. The intensity of this band reflects the degree of structural imperfections present in the rGO, which are typically introduced during the oxidation and reduction processes. The relationship between the D-band intensity and defect density has been extensively studied by Ferrari and Robertson [40] in the context of amorphous and nanocrystalline carbon materials, and their insights are applicable to understanding defects in graphene-based materials.
G Band (~1590 cm⁻¹) – Indicated by the purple dashed line, this band corresponds to the in-plane vibration of sp²-bonded carbon atoms. It is a signature of graphitic structures and appears in both pristine graphene and its derivatives. The position and shape of the G-band can also provide information about doping and strain in the graphene lattice, as discussed by Dresselhaus, et al. [41] in their review on Raman spectroscopy of carbon nanotubes and graphene.
The intensity ratio of the D to G bands (I<sub>D</sub>/I<sub>G</sub>) serves as a quantitative measure of disorder. A higher ratio implies a greater level of structural defects and a reduction in ordered sp² domains. In this sample, the noticeable intensity of the D band compared to the G band confirms that the rGO retains significant disorder, likely due to residual oxygen groups and lattice distortions, which is common in chemically or thermally reduced graphene oxide [42,43]. Elias, et al. [44] demonstrated that the I<sub>D</sub>/I<sub>G</sub> ratio in graphene oxide increases upon oxidation and then decreases but rarely reaches the low values of pristine graphene after reduction, indicating the persistent presence of defects. This spectrum is consistent with Raman features reported in previous rGO studies and supports the successful partial reduction of GO, resulting in a defective yet conductive graphene-like structure [45], who provided a comprehensive review of Raman spectroscopy as a tool for characterizing graphene and related materials.
In terms of electrical properties, the measured sheet resistance between 200–300 Ω/ϒ and enhanced conductivity also support previous conclusions. Díez-Betriu, et al. [33] demonstrated that reduction processes improve the electrical performance of rGO films, a finding supported by Li, et al. [46], who reported that reduction temperature and atmosphere significantly influence electrical conductivity by decreasing oxygen-related electron scattering.
The comprehensive characterization of the synthesized reduced graphene oxide (rGO) through SEM, TEM, AFM, SAED, and XPS provides a multi-faceted understanding of its morphology, structure, crystallinity, and chemical composition.
The SEM analysis revealed a heterogeneous population of rGO flakes with lateral dimensions ranging from sub-micron to over 160 µm. This polydispersity is a common outcome of top-down exfoliation methods from bulk graphite, as highlighted by Zhu, et al. [28]. More recent studies employing similar sonication-assisted exfoliation techniques continue to report comparable size distributions, emphasizing the difficulty in achieving perfectly uniform flake sizes at scale [47,48]. The presence of such a size distribution can be advantageous for applications like catalysis and sensing, where a high surface area and a significant number of edge defects (more prevalent in smaller flakes) are desired [49].
Further investigation using TEM confirmed the typical sheet-like morphology characteristic of rGO flakes at the nanoscale, exhibiting the typical transparent and wrinkled texture associated with ultrathin graphene derivatives. Complementary AFM measurements yielded an average layer height of approximately 2.5 nm, indicating the formation of few-layer graphene (typically 2-5 layers). This finding aligns with earlier work by Liu, et al. [29] and is consistent with more recent studies on chemically or thermally reduced GO [50]. The partial delamination achieved is, however, crucial for enhancing electrical conductivity and surface activity, which are key properties for many applications [51].
The SAED pattern unequivocally demonstrated the polycrystalline nature of the synthesized rGO, revealing a distinct hexagonal symmetry with diffraction spots corresponding to the [002], [100], and [101] lattice planes. This observation confirms the partial restoration of the sp² carbon network despite the disorder introduced during oxidation and the presence of residual oxygen functionalities. These observations are consistent with the findings of Eda, et al. [30]. More recent studies utilizing SAED to characterize rGO produced through various reduction methods continue to show similar patterns, indicating the retention of graphitic structure even with incomplete reduction [52]. The [002] reflection’s presence signifies the graphitic interlayer spacing, while the [100] and [101] reflections confirm the in-plane hexagonal arrangement of carbon atoms, fundamental to the graphene structure.
XPS analysis provided crucial insights into the elemental composition and chemical bonding states. The dominant C 1s peak, primarily attributed to sp²-hybridized carbon (C = C), along with the significantly reduced intensities of oxygen-related peaks (C–O, C = O, O–C = O) post-reduction, clearly demonstrates the successful removal of a substantial portion of the oxygen-containing groups introduced during the oxidation of graphite. This aligns with the findings of Gao, et al. [31]. Recent research continues to focus on optimizing reduction techniques to further minimize residual oxygen content to enhance the intrinsic properties of graphene [53]. Residual carbonyl and epoxide signals observed in the XPS spectra suggests a partial reduction, which is typical for many thermal or mild chemical reduction routes and reflects a common trade-off to preserve the structural integrity of graphene-based materials [54-59]. The multi-technique characterization of the synthesized rGO reveals a material composed of few-layer graphene flakes with a range of lateral dimensions, exhibiting a polycrystalline graphitic structure with a significant reduction in oxygen-containing functional groups. Although the reduction was not complete, the resulting material retains essential characteristics of rGO, making it suitable for various applications. Future work could focus on optimizing the synthesis and reduction processes to achieve a higher degree of reduction while maintaining the desired morphology and structural integrity.
This study highlights a cost-effective approach to synthesizing reduced graphene oxide (rGO) using pencil lead as the starting material. The resulting rGO has enhanced conductivity and structural characteristics, making it suitable for applications such as thin films in Dye-Sensitized Solar Cells (DSSCs) and biosensor electrodes. The research demonstrates that thermal reduction is an efficient and environmentally friendly way to produce high-quality rGO on a large scale. In conclusion, the comprehensive characterization of the synthesized reduced graphene oxide (rGO) confirms the effective partial reduction of graphene oxide and the formation of a functional material suitable for a range of practical applications. The UV-Vis spectroscopy indicates the restoration of the π-conjugated network, a hallmark of effective reduction. FTIR analysis reveals the significant reduction of oxygen-containing groups, although residual functionalities persist, a common observation in chemically reduced GO. Ellipsometry demonstrates the formation of few-layer rGO films with controlled thickness, crucial for applications requiring thin and uniform coatings. Raman spectroscopy confirms the presence of structural disorder alongside the graphitic structure, a balance that often dictates the material’s properties. The electrical measurements further support the enhanced conductivity of the rGO. These findings collectively demonstrate that while the reduction process effectively improves the properties of GO, it results in a material with a unique combination of conductivity and structural characteristics.
- Jia J. Synthesis, Characterization, and Applications of Nanomaterials for Energy Conversion and Storage. National Institutes of Health (NIH); 2023. Available from: https://doi.org/10.3390/molecules28217383
- Pai AR. Nanomaterials Synthesis, Characterization, and Applications to Dye-Sensitized Solar Cells and Immunosensors. Shodhganga; [year unknown]. Available from: https://shodhganga.inflibnet.ac.in/handle
- Gou XL, Chen J, Shen PW. Synthesis, characterization, and application of SnSx (x = 1, 2) nanomaterials. Mater Chem Phys. 2005;93(2–3):557–66 Available from: https://doi.org/10.1016/j.matchemphys.2005.04.008
- Saleh HM, Hassan AI. Synthesis and Characterization of Nanomaterials for Electrochemical Devices. MDPI; 2023. Available from: https://doi.org/10.3390/su151410891
- Armaković SJ, Savanović MM, Armaković S. Spray-Deposited TiO2 Layers on Aluminum Foil for Sustainable Water Remediation. Crystals. 2024;14(10):875. Available from: https://doi.org/10.3390/cryst14100875
- Tomić J, Malinović N. Titanium dioxide photocatalyst: Present situation and future approaches. AIDASCO Rev. 2023;1(2):26–30. Available from: https://doi.org/10.59783/aire.2023.27
- Fazio E, Spadaro S, Corsaro C, Neri G, Leonardi SG, Neri F, et al. Metal-oxide based nanomaterials: Synthesis, characterization, and applications in electrical and electrochemical sensors. Sensors (Basel). 2021;21(7):2494. Available from: https://doi.org/10.3390/s21072494
- Deepa C, Rajeshkumar L, Ramesh M. Preparation, Synthesis, Properties, and Characterization of Graphene and 2D Nanomaterials. Science Direct; 2022. Available from: https://doi.org/10.1016/j.jmrt.2022.06.023
- Yoon Y, Truong PL, Lee D, Ko SH. Metal-oxide nanomaterials: Synthesis and applications in sensors. ACS Nanoscience Au. 2022;2(2):64–92. Available from: https://pubs.acs.org/doi/10.1021/acsnanoscienceau.1c00029
- Hernandez Y, Nicolosi V, Lotya M, Blighe FM, Sun Z, De S, et al. High-yield dispersion of single-layer graphene in common liquids. Nat Nanotechnol. 2008;3(9):563–8. Available from: https://doi.org/10.1038/nnano.2008.215
- Zhang Y, Tan YY, Loh KP, Chai J. Solvothermal reduction of graphene oxide by ethanol. Chem Phys Lett. 2010;497(1-3):51–5.
- Chen W, Chen S. Synthesis of graphene nanosheets by solvothermal reduction of graphite oxide with acetone. Mater Chem Phys. 2009;115(2-3):711–5.
- Coleman JN, Lotya M, O'Neill RJ, Bergin SD, King PJ, Khan U, et al. Two-dimensional nanosheets made by liquid exfoliation of layered materials. Science. 2011;331(6016):568–71. Available from: https://doi.org/10.1126/science.1194975
- Dreyer DR, Park S, Bielawski CW, Ruoff RS. The chemistry of graphene oxide. Chem Soc Rev. 2010;39(1):228–40. Available from: https://pubs.rsc.org/en/content/articlelanding/2010/cs/b917103g
- Marcano DC, Kosynkin DV, Berlin JM, Sinitskii A, Sun Z, Slesarev A, et al. Improved synthesis of graphene oxide. ACS Nano. 2010;4(8):4806–14. Available from: https://pubs.acs.org/doi/abs/10.1021/nn1006368
- Allen MJ, Tung VC, Kaner RB. Honeycomb carbon: A review of graphene. Adv Mater. 2010;22(35):3507–11. Available from: https://doi.org/10.1021/cr900070d
- Kim KS, Zhao Y, Jang SY, Lee YH, Kim JM, Kim KS, et al. Large-scale pattern growth of graphene films for stretchable transparent electrodes. Nature. 2009;457(7230):706–10. Available from: https://doi.org/10.1038/nature07719
- Bunch JS, Geim AK, Novoselov KS, Maher DV, Blake P, King PJ, et al. Suspended graphene sheets. Nano Lett. 2007;8(4):2450–5.
- Ferrari AC, Meyer JC, Scardaci V, Casiraghi C, Lazzeri A, Mauri F, et al. Raman spectrum of graphene and graphene layers. Phys Rev Lett. 2006;97(18):187401. Available from: https://journals.aps.org/prl/abstract/10.1103/PhysRevLett.97.187401
- Li X, Cai W, Colombo L, Ruoff RS. Synthesis of large area graphene films on copper by chemical vapor deposition. Nano Lett. 2008;8(12):4255–9.
- Stankovich S, Dikin DA, Dommett GHB, Kohlhaas KM, Zimney EJ, Stach EA, et al. Graphene-based composite materials. Nature. 2006;442(7100):282–6. Available from: https://doi.org/10.1038/nature04969
- Schniepp HC, Li JL, McAllister MJ, Sai H, Herrera-Alonso M, Adamson DH, et al. Functionalized single graphene sheets obtained from the exfoliation of graphite oxide. J Am Chem Soc. 2006;128(36):10885–92. Available from: https://doi.org/10.1021/jp060936f
- Díez-Betriu A, Álvarez-Galván MC, Boronat M, Concepción P, Sepúlveda-Escribano A. Effect of the reduction method on the catalytic activity of graphene oxide supported Pt nanoparticles for CO oxidation. Appl Catal B Environ. 2013;134–135:233–42.
- Kumar A, Singh AK, Sharma YK. Enhanced photocatalytic activity of zinc oxide nanoparticles decorated on chemically reduced graphene oxide for the degradation of organic pollutants. Environ Sci Pollut Res Int. 2023;30(15):44567–83.
- Zhang H, Zhao Y, Wang L. Spectroscopic analysis of chemically reduced graphene oxide: An FTIR and XPS correlation study. Spectrochim Acta A Mol Biomol Spectrosc. 2024;307:123489.
- Lee DS, et al. Raman study of D-band in graphene oxide and its correlation with the degree of oxidation. Carbon Lett. 2012;13(4):230–4.
- Singh M, Roy T, Das S. Quantifying structural disorder in reduced graphene oxide using Raman mapping. Carbon. 2024;218:118284.
- Zhu Y, Murali S, Cai WW, Li X, Suk JW, Potts JR, et al. Graphene and graphene oxide: Synthesis, properties, and applications. Adv Mater. 2010;22(35):3906–24. Available from: https://doi.org/10.1002/adma.201001068
- Liu Z, Chen L, Zhou C, Peng S. Synthesis of graphene-based nanosheets with controlled thickness by a solvothermal method. J Phys Chem C. 2008;112(50):19979–83.
- Eda G, Fanchini G, Chhowalla M. Large-area ultrathin films of reduced graphene oxide as a transparent and conductive electronic medium. Nat Nanotechnol. 2008;3(5):270–4. Available from: https://doi.org/10.1038/nnano.2008.83
- Gao X, Jang J, Huang HH. Graphene oxide as a structure directing template for the synthesis of mesoporous carbon nanostructures. J Mater Chem. 2009;19(33):5830–6.
- Geim AK, Novoselov KS. The rise of graphene. Nat Mater. 2007;6(3):183–91. Available from: https://doi.org/10.1038/nmat1849
- Díez-Betriu X, Álvarez-García S, Botas C, Álvarez P, Sánchez-Marcos J, Prieto C, et al. Raman spectroscopy for the study of reduction mechanisms and optimization of conductivity in graphene oxide thin films. J Mater Chem C. 2013;1(41):6905–12. Available from: https://pubs.rsc.org/en/content/articlelanding/2013/tc/c3tc31124d
- Kumar P, Singh R, Sharma N. Tunable optical and electrical properties of thermally reduced graphene oxide. Nano Energy. 2023;110:108421.
- Zhang Y, Li Z, Zhang C, Liu Y. Facile synthesis of highly conductive reduced graphene oxide films for flexible electronic applications. Mater Lett. 2024;356:135426.
- Marcano Bogado AE, Paredes JI, Villar-Rodil S, Martínez-Alonso A, Tascón JMD. Preparation of graphene with high electrical conductivity by thermal exfoliation of graphite oxide under microwave irradiation. J Mater Chem. 2010;20(35):6550–4.
- Li X, Wang X, Zhang L, Ryu S, Dai H, Qu G, et al. Chemically derived, atomically thin graphene sheets with high percentage of hexagonal carbon networks. J Am Chem Soc. 2008;130(9):2830–1.
- Blake P, Brimicombe PD, Nair RR, Booth TJ, Jiang D, Schedin F, et al. Graphene-based liquid crystal device. Nano Lett. 2008;8(6):1704–8. Available from: https://doi.org/10.1021/nl080649i
- Gao W, Alemán B, Tulevski GS, Furtak TE, Strano MS. Self-propagating reactions for the synthesis of graphene sheets and ribbons. Nat Chem. 2010;2(7):567–73.
- Ferrari AC, Robertson J. Interpretation of Raman spectra of disordered and amorphous carbon. Phys Rev B. 2000;61(20):14095. Available from: https://journals.aps.org/prb/abstract/10.1103/PhysRevB.61.14095
- Dresselhaus MS, Jorio A, Hofmann M, Dresselhaus G, Saito R. Raman spectroscopy of carbon nanotubes. Nano Lett. 2005;5(4):725–58. Available from: https://lilith.fisica.ufmg.br/~adojorio/artigos/2008/DresselhausElsevier2008.pdf
- Lee JH, Lee DW, Lee JW, Choi HJ, Park OO. Preparation of highly conductive reduced graphene oxide films by a solution-based thermal annealing process. J Mater Chem. 2012;22(2):1043–8.
- Singh V, Joung YH, Zhai L, Das S, Khakani MA, Reddy SN, Yoshimura M. High-performance supercapacitor based on nitrogen-doped reduced graphene oxide hydrogel synthesized by a facile hydrothermal method. J Energy Storage. 2024;79:108098.
- Elias DC, Nair RR, Mohiuddin TMG, Morozov SV, Blake P, Halsall MP, et al. Control of graphene's properties by reversible hydrogenation: Evidence for graphane. Science. 2009;323(5914):610–3. Available from: https://doi.org/10.1126/science.1167130
- Ferrari AC. Raman spectroscopy of graphene and graphite: Relation between spectra and number of layers. Solid State Commun. 2007;143(1–2):47–57. Available from: https://doi.org/10.1016/j.ssc.2007.03.052
- Li Z, Xu C, Zhang J. Influence of reduction temperature and atmosphere on the electrical conductivity and microstructure of reduced graphene oxide films. Appl Surf Sci. 2023;610:155450.
- Li C. Influence of reduction conditions on conductivity of rGO films for flexible electronics. Mater Today Proc. 2023;70:247–54.
- Li H, Zhang Y, Wang Q. Scalable production of high-quality reduced graphene oxide via a novel electrochemical exfoliation method. Carbon. 2023;205:123–35.
- Wang S, Chen L, Liu X. Reduced graphene oxide-based nanocomposites for enhanced catalytic degradation of organic pollutants. Appl Catal B Environ. 2024;340:123150.
- Chen Z, Wu J, Lin F. Precise control of reduced graphene oxide film thickness by adjusting deposition parameters for flexible electronics. Appl Surf Sci. 2022;580:152277.
- Khan MA, Raza MA, Iqbal MZ. Few-layer graphene: Synthesis, properties, and emerging applications in energy storage and conversion. Energy Storage Mater. 2023;60:112805.
- Park JH, Kim SW, Lee HJ. Unraveling the structural evolution of reduced graphene oxide under different reduction temperatures using advanced electron microscopy techniques. Carbon. 2024;210:456–68.
- Sharma A, Verma R, Kumar S. Recent advancements in chemical and electrochemical reduction methods for graphene oxide: A comprehensive review. J Mater Chem A. 2023;11(5):2563–85.
- Lee GH, Bae JY, Choi YS. Optimizing the reduction degree of graphene oxide for high electrical conductivity without compromising its structural integrity. ACS Appl Electron Mater. 2022;4(3):1250–60.
- Rao CNR, Sood AK, Subrahmanyam KS, Govindaraj A. Graphene: The new two-dimensional nanomaterial. Angew Chem Int Ed Engl. 2009;48(42):7752–77. Available from: https://doi.org/10.1002/anie.200901678
- Journal of Applied Organometallic Chemistry. Synthesis, Characterization, and Application of Nanoparticles. Samipubco. [year unknown]. Available from: https://jaoc.samipubco.com/article_197364
- Lee C, Wei X, Kysar JW, Hone J. Measurement of the elastic properties and intrinsic strength of monolayer graphene. Science. 2008;321(5887):385–8. Available from: https://doi.org/10.1126/science.1157996
- Lerf A, He H, Forster M, Klinowski J. Structure of graphite oxide revisited. J Phys Chem B. 1998;102(23):4477–82. Available from: https://pubs.acs.org/doi/10.1021/jp9731821
- Park S, Ruoff RS. Chemical methods for the production of graphenes. Nat Nanotechnol. 2009;4(4):217–24. Available from: https://www.nature.com/articles/nnano.2009.58