Figure 3
The role of Diffusion-Weighted Imaging in better delineating the extent of Diffuse Axonal Injury in a pediatric patient: A case report and brief review of the literature
Aikaterini Solomou*, Pantelis Kraniotis and Vasileios Patriarcheas
Published: 09 April, 2020 | Volume 4 - Issue 1 | Pages: 022-025

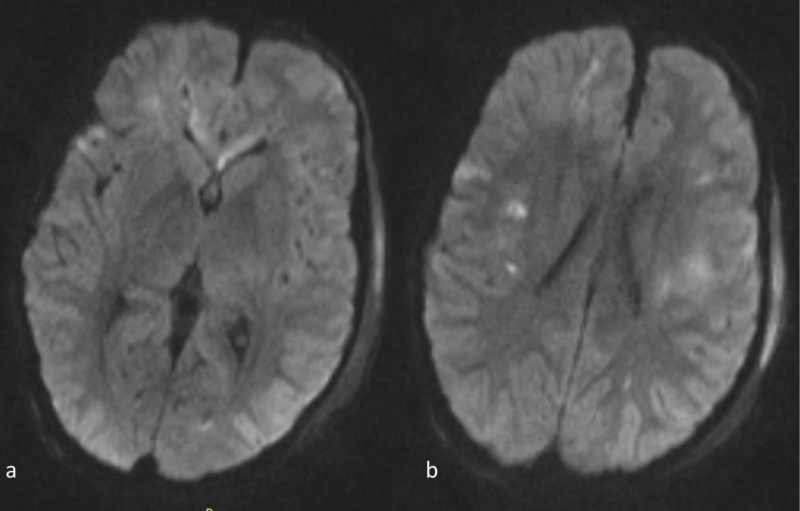
Figure 3:
3 a,b: Axial DWI images at the same level as 1a,b. The abnormal signal intensity in the genu of the corpus callosum and the subcortical and deep white matter is more conspicuous than on the FLAIR images. Note also that the abnormal signal intensity with hyperintense lesions extends bilaterally far beyond the areas of abnormal signal on the FLAIR images (compare to 1a-b).
Read Full Article HTML DOI: 10.29328/journal.acr.1001034 Cite this Article Read Full Article PDF
More Images
Similar Articles
-
The role of Diffusion-Weighted Imaging in better delineating the extent of Diffuse Axonal Injury in a pediatric patient: A case report and brief review of the literatureAikaterini Solomou*,Pantelis Kraniotis,Vasileios Patriarcheas. The role of Diffusion-Weighted Imaging in better delineating the extent of Diffuse Axonal Injury in a pediatric patient: A case report and brief review of the literature. . 2020 doi: 10.29328/journal.acr.1001034; 4: 022-025
Recently Viewed
-
Development of Latent Fingerprints Using Food Coloring AgentsKallu Venkatesh,Atul Kumar Dubey,Bhawna Sharma. Development of Latent Fingerprints Using Food Coloring Agents. J Forensic Sci Res. 2024: doi: 10.29328/journal.jfsr.1001070; 8: 104-107
-
Crime Scene Examination of Murder CaseSubhash Chandra*,Pradeep KR,Jitendra P Kait,SK Gupta,Deepa Verma. Crime Scene Examination of Murder Case. J Forensic Sci Res. 2024: doi: 10.29328/journal.jfsr.1001071; 8: 108-110
-
Cost Variation Analysis of Various Brands of Anti-Depressants Agents Currently Available in Indian MarketsManpreet, Shamsher Singh, GD Gupta, Khadga Raj Aran*. Cost Variation Analysis of Various Brands of Anti-Depressants Agents Currently Available in Indian Markets. J Neurosci Neurol Disord. 2023: doi: 10.29328/journal.jnnd.1001076; 7: 017-021
-
Sleep quality and Laboratory Findings in Patients with Varicose Vein Leg PainIbrahim Acır*, Zeynep Vildan Okudan Atay, Mehmet Atay, Vildan Yayla. Sleep quality and Laboratory Findings in Patients with Varicose Vein Leg Pain. J Neurosci Neurol Disord. 2023: doi: 10.29328/journal.jnnd.1001077; 7: 022-026
-
Non-surgical Treatment of Verrucous Hyperplasia on Amputation Stump: A Case Report and Literature ReviewSajeda Alnabelsi*, Reem Hasan, Hussein Abdallah, Suzan Qattini. Non-surgical Treatment of Verrucous Hyperplasia on Amputation Stump: A Case Report and Literature Review. Ann Dermatol Res. 2024: doi: 10.29328/journal.adr.1001034; 8: 015-017
Most Viewed
-
Evaluation of Biostimulants Based on Recovered Protein Hydrolysates from Animal By-products as Plant Growth EnhancersH Pérez-Aguilar*, M Lacruz-Asaro, F Arán-Ais. Evaluation of Biostimulants Based on Recovered Protein Hydrolysates from Animal By-products as Plant Growth Enhancers. J Plant Sci Phytopathol. 2023 doi: 10.29328/journal.jpsp.1001104; 7: 042-047
-
Sinonasal Myxoma Extending into the Orbit in a 4-Year Old: A Case PresentationJulian A Purrinos*, Ramzi Younis. Sinonasal Myxoma Extending into the Orbit in a 4-Year Old: A Case Presentation. Arch Case Rep. 2024 doi: 10.29328/journal.acr.1001099; 8: 075-077
-
Feasibility study of magnetic sensing for detecting single-neuron action potentialsDenis Tonini,Kai Wu,Renata Saha,Jian-Ping Wang*. Feasibility study of magnetic sensing for detecting single-neuron action potentials. Ann Biomed Sci Eng. 2022 doi: 10.29328/journal.abse.1001018; 6: 019-029
-
Pediatric Dysgerminoma: Unveiling a Rare Ovarian TumorFaten Limaiem*, Khalil Saffar, Ahmed Halouani. Pediatric Dysgerminoma: Unveiling a Rare Ovarian Tumor. Arch Case Rep. 2024 doi: 10.29328/journal.acr.1001087; 8: 010-013
-
Physical activity can change the physiological and psychological circumstances during COVID-19 pandemic: A narrative reviewKhashayar Maroufi*. Physical activity can change the physiological and psychological circumstances during COVID-19 pandemic: A narrative review. J Sports Med Ther. 2021 doi: 10.29328/journal.jsmt.1001051; 6: 001-007

HSPI: We're glad you're here. Please click "create a new Query" if you are a new visitor to our website and need further information from us.
If you are already a member of our network and need to keep track of any developments regarding a question you have already submitted, click "take me to my Query."


