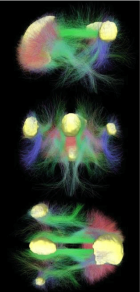
Figure 4
PET TAC and Resting state EEG-fMRI in Evaluation of the Ability to Understand and want in Patients Affected by Dementias with Neuro-psychiatric Disorders and other Mental Disorders
Mirko Avesani*, Graziella Beghini, Francesco Agnoliucilla Franchi, Camilla Vianello, Assunta Zamparelli, Cristiana Trevisan, Cinzia Scarpa, Nicola Siliprandi, Manuela Camiciaaura Adamiaura Rossiicia Mazzocchi, Maria Antonietta Conforto and L
Published: 11 January, 2024 | Volume 8 - Issue 1 | Pages: 001-009
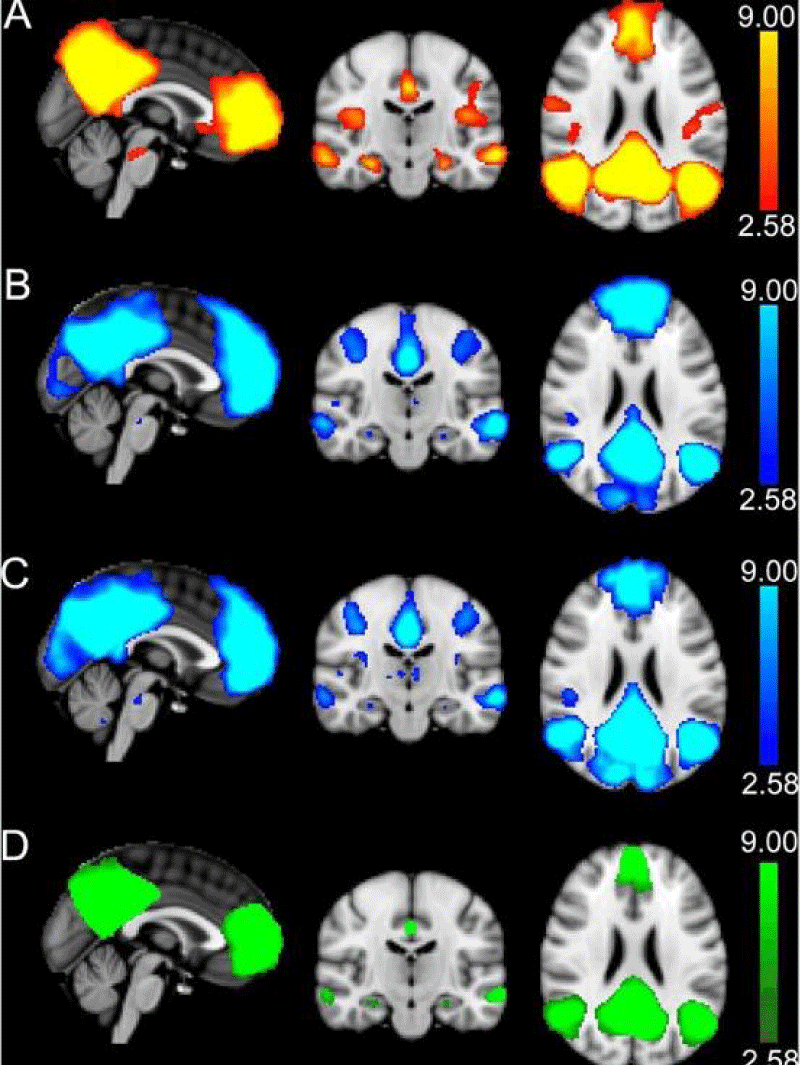
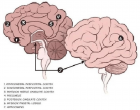
Figure 4:
Figure 4: Identification of DMN with the results of independent component analysis (ICA) in Alzheimer’s disease.
A: ICA was used to identify the DMN components in rs-fMRI data. B-C: ICA was performed separately for run 1 (B) and run 2 (C) of task-based fMRI. The task components were averaged and masked by the rs-fMRI component to form a final mask of the DMN (C). The clusters in this final mask were used for all functional analyses and as seeds for probabilistic tractography. A-D: The DMN regions overlap with the MNI151 T1 2mm3 standard brain. The colour scale is shown on the right, with the values representing the minimum and the maximum Z-values. By Brown, et al. [5],
Read Full Article HTML DOI: 10.29328/journal.acr.1001086 Cite this Article Read Full Article PDF
More Images
Similar Articles
-
PET TAC and Resting state EEG-fMRI in Evaluation of the Ability to Understand and want in Patients Affected by Dementias with Neuro-psychiatric Disorders and other Mental DisordersMirko Avesani*, Graziella Beghini, Francesco Agnoli, Lucilla Franchi, Camilla Vianello, Assunta Zamparelli, Cristiana Trevisan, Cinzia Scarpa, Nicola Siliprandi, Manuela Camicia, Laura Adami, Laura Rossi, Licia Mazzocchi, Maria Antonietta Conforto, L. PET TAC and Resting state EEG-fMRI in Evaluation of the Ability to Understand and want in Patients Affected by Dementias with Neuro-psychiatric Disorders and other Mental Disorders. . 2024 doi: 10.29328/journal.acr.1001086; 8: 001-009
Recently Viewed
-
Various Theories of Fast and Ultrafast Magnetization DynamicsManfred Fähnle*. Various Theories of Fast and Ultrafast Magnetization Dynamics. Int J Phys Res Appl. 2024: doi: 10.29328/journal.ijpra.1001101; 7: 154-158
-
Forest History Association of WisconsinEd Bauer*. Forest History Association of Wisconsin. J Radiol Oncol. 2024: doi: 10.29328/journal.jro.1001071; 8: 093-096
-
Synthesis of Carbon Nano Fiber from Organic Waste and Activation of its Surface AreaHimanshu Narayan*,Brijesh Gaud,Amrita Singh,Sandesh Jaybhaye. Synthesis of Carbon Nano Fiber from Organic Waste and Activation of its Surface Area. Int J Phys Res Appl. 2019: doi: 10.29328/journal.ijpra.1001017; 2: 056-059
-
Obesity Surgery in SpainAniceto Baltasar*. Obesity Surgery in Spain. New Insights Obes Gene Beyond. 2020: doi: 10.29328/journal.niogb.1001013; 4: 013-021
-
Tamsulosin and Dementia in old age: Is there any relationship?Irami Araújo-Filho*,Rebecca Renata Lapenda do Monte,Karina de Andrade Vidal Costa,Amália Cinthia Meneses Rêgo. Tamsulosin and Dementia in old age: Is there any relationship?. J Neurosci Neurol Disord. 2019: doi: 10.29328/journal.jnnd.1001025; 3: 145-147
Most Viewed
-
Evaluation of Biostimulants Based on Recovered Protein Hydrolysates from Animal By-products as Plant Growth EnhancersH Pérez-Aguilar*, M Lacruz-Asaro, F Arán-Ais. Evaluation of Biostimulants Based on Recovered Protein Hydrolysates from Animal By-products as Plant Growth Enhancers. J Plant Sci Phytopathol. 2023 doi: 10.29328/journal.jpsp.1001104; 7: 042-047
-
Sinonasal Myxoma Extending into the Orbit in a 4-Year Old: A Case PresentationJulian A Purrinos*, Ramzi Younis. Sinonasal Myxoma Extending into the Orbit in a 4-Year Old: A Case Presentation. Arch Case Rep. 2024 doi: 10.29328/journal.acr.1001099; 8: 075-077
-
Feasibility study of magnetic sensing for detecting single-neuron action potentialsDenis Tonini,Kai Wu,Renata Saha,Jian-Ping Wang*. Feasibility study of magnetic sensing for detecting single-neuron action potentials. Ann Biomed Sci Eng. 2022 doi: 10.29328/journal.abse.1001018; 6: 019-029
-
Pediatric Dysgerminoma: Unveiling a Rare Ovarian TumorFaten Limaiem*, Khalil Saffar, Ahmed Halouani. Pediatric Dysgerminoma: Unveiling a Rare Ovarian Tumor. Arch Case Rep. 2024 doi: 10.29328/journal.acr.1001087; 8: 010-013
-
Physical activity can change the physiological and psychological circumstances during COVID-19 pandemic: A narrative reviewKhashayar Maroufi*. Physical activity can change the physiological and psychological circumstances during COVID-19 pandemic: A narrative review. J Sports Med Ther. 2021 doi: 10.29328/journal.jsmt.1001051; 6: 001-007

HSPI: We're glad you're here. Please click "create a new Query" if you are a new visitor to our website and need further information from us.
If you are already a member of our network and need to keep track of any developments regarding a question you have already submitted, click "take me to my Query."


